


Article summary: Learn why Power BI, a cloud-based, centralized source for data insights, is ideal for companies that need to analyze large volumes of data and work collaboratively.
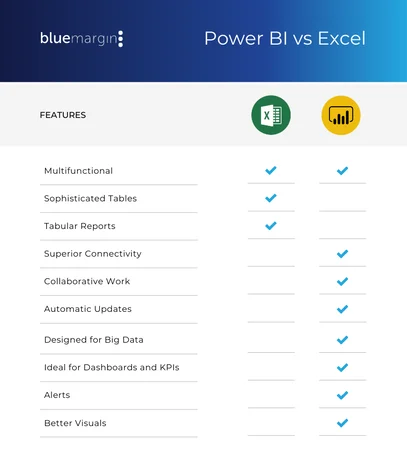
Microsoft Excel has been the go-to spreadsheet software program for years. With its easy-to-use interface and flexibility for individual analysis, it’s clear why so many organizations default to it for their data management and visualization. Many businesses think Excel is all they’ll ever need.
Then there’s Power BI — a collection of software, apps, and connectors that work together to turn your data into insightful visuals, making big data easier to analyze. It’s a significant step up from a spreadsheet. With a lot more functionality and possibility, Power BI can be overwhelming to many businesses, or even seen as unnecessary.
It can be confusing to know when to go with Power BI vs. Excel, and why. In reality, it doesn’t have to be an either/or situation, but rather a when and for what. Understanding when to utilize which tool can cut down on systemic confusion, strengthen your team’s efficiencies, drive your profitability, and more.
Power BI: The Powerhouse for Data Visibility and Analysis
Power BI is the gold standard of data analysis tools, designed for businesses striving to become truly data-driven. This robust data solution doesn’t consist of disparate spreadsheets; it’s a full-fledged analytics platform that packs a serious punch.
Using Power BI is like having an advanced GPS with real-time traffic updates and route optimization in a busy city. It helps you navigate through vast amounts of data efficiently as well as:
- Provides insightful visualizations of your journey
- Suggests the best paths to take
- Adapts quickly to changing conditions
…all while other tools might leave you lost or stuck in data traffic jams.
Power BI offers more than an ability to shoulder large data sets with ease. It also has advanced capabilities for data modeling and importing. That makes it easier to synthesize information from disconnected sources and present it in a visually appealing, digestible way.
Here’s a quick example. Let’s say you need to optimize global supply chain efficiency to improve profit margins across multiple product lines. With Power BI, you can create a comprehensive dashboard that integrates data from various international sources including manufacturing plants, shipping partners, distribution centers, and point-of-sale systems. This gives you a real-time, holistic view of your entire supply chain ecosystem.
Or perhaps you’re looking to increase the utilization of your field technicians, maximizing their revenue-generating time. Power BI can pull data from various systems, providing a comprehensive view of each technician’s productivity. Armed with this insight, you can optimize routes, prioritize high-value tasks, and ensure your team is operating at peak efficiency.
Where Power BI Shines:
- Driving the right behaviors and decisions to increase profitability.
- Monitoring KPIs across multiple data sources or automating report generation and distribution.
- Keeping everyone updated on metrics in real-time.
Ultimately, Power BI drives the right behaviors and decisions to boost profitability. By monitoring KPIs across multiple data sources and automating report generation, you get the right information to the right people at the right time, eliminating your reliance on outdated spreadsheets or conflicting information.
Excel: The Versatile Tool for Individual Analysis
While Power BI shines in enterprise analytics, Excel remains a trusted copilot for individual use without the learning curve. How many times have you read “proficient in Microsoft Excel” on a resume? There is some merit to that, however. Plainly put, more people know how to use Excel than Power BI. Excel’s interface is also more accessible, user-friendly and flexible, making it ideal for personal productivity, one-off tasks, and ad-hoc analysis.
Excel’s strength lies in catering to individual users dealing with small amounts of data. Researchers can use it to crunch numbers, spot trends, and explore hypotheses. Managers can analyze project data to fuel creative strategies.
The software also serves as a reliable tool for personal productivity tasks — from creating simple reports to organizing data for presentations or budgeting exercises.
Where Excel Shines:
- Personal Productivity: Excel is ideal for tasks like sales forecasts or expense analysis, allowing users to crunch numbers and present findings professionally.
- Ad-hoc Analysis: When faced with new data sources or processes, Excel enables immediate exploration without waiting for complex setups.
- Scientific Research: Scientists can use Excel as a digital laboratory, recording and analyzing experimental data to spot patterns and trends.
While it may not match Power BI’s enterprise-level capabilities, Excel’s versatility and ease of use make it an indispensable tool for granular, everyday data tasks.
How to Choose the Right Analytics Tool for the Job
Power BI and Excel are both powerful analytics tools, albeit suited for different needs. Power BI is the optimal choice for enterprise-level data analysis, enabling organizations to handle large datasets, create complex visualizations, and facilitate collaborative decision-making. It drives profitability, streamlines processes, and ensures everyone works with validated information.
Excel, on the other hand, is the go-to tool for individual exploration, ad-hoc analysis, and personal productivity tasks. Its user-friendly interface and flexibility make it perfect for quickly analyzing data from new sources or testing hypotheses.
Ultimately, the key is understanding the strengths of each tool and selecting the right one for the task at hand. Keep each system in your toolkit and stay ahead of the curve.
Curious about what a Power BI dashboard looks like? Go to our Industry Solutions page to test drive a dashboard.