


Article Summary: A paraphrased excerpt from The Dashboard Effect highlighting the benefits of implementing a data warehouse to support Power BI dashboard reporting. These essentials and best practices apply to data lakehouses as well, which is our current approach that allows companies to prepare their data for the additional benefit of AI.
Despite best efforts and investments, few companies understand how to sustainably and strategically manage their data and use it to increase growth and margins.
As a PE-backed company plans to reap more insights from their data, understanding that the quality of insights will be limited to how well your data warehouse mirrors your business structure and logic is the right place to start. To be report-ready, data needs to be gathered, organized, and cleaned in response to the tactics you want to implement, the problems you want to fix, and ultimately, the metrics that drive those efforts. In other words, a data warehouse starts with your business strategy. Approaching your data warehouse from a technical perspective will find you chasing your tail, indefinitely. And a technical approach leaves most companies stymied by the complexity of their data ecosystem.
Click to learn more about How Manufacturing Uses Dashboards To Increase Profitability
Data comes from countless systems – accounting, sales, operations, marketing, HR, etc. Even small start-ups can have ten or more data sources.
Though designed to help improve efficiency, software systems can also sabotage progress by creating silos of information.
When information is siloed across an organization, manually generating a cohesive view of performance can prove nearly impossible. Leaving data disconnected hinders your ability to compete in a market where companies are using data as a tool to drive their value creation plans by elevating measurement and accountability.
For data to be useful, it must be gathered, distilled, and connected in a way that reflects your business model.
This is the role of the data warehouse.
Drawbacks of Excel Data Management
While a data warehouse is the best tool for gathering, distilling, and connecting data, it is not the most commonly used. Excel is. While virtually indispensable, Excel files are rarely governed and can therefore easily proliferate, having the ironic effect of exacerbating a company’s data entropy.
How many of these Excel headaches ring true at your company?
- High-cost resources spend countless hours assembling and manipulating Excel reports instead of engaging in their highest and best use.
- Someone uses an outdated version of an Excel file, resulting in wasted work.
- Two people make changes to a shared Excel file at the same time, causing one to be overwritten.
- An Excel file with critical data, perhaps the only copy, is lost in the chaos of e-mails, shared-drives, and folders.
- A shared spreadsheet is deleted by someone who doesn’t realize it’s still needed by others.
- Someone changes a workbook, inadvertently breaking macros, linked workbooks, and reports.
- An Excel file can’t be accessed because it lives on the laptop of someone who is out of office.
Trying to tame your business data through a melee of Excel files is decidedly frustrating. We’ve seen it over and over. Excel-dependent organizations are perpetually hampered by missing, faulty, and/or outdated data. Data warehouses overcome these issues.
Why build a data warehouse?
A Data Warehouse:
- Protects your business systems.
- Is the single source of truth.
- Is ACID (Atomicity, Consistency, Isolation, Durability).
- Maintains historical accuracy and historical context.
- Holds massive quantities of data.
- Serves up reporting with speed.
- Can be made regulation compliant (e.g., SOX, PCI, FERPA, HIPAA, SSAE16).
- Is secure.
- Is reliable.
- Data warehouses are affordable.
- Choosing not to build a data warehouse is taking on technical debt.
The Role of a Data Warehouse
While importing your Excel data into a single dashboarding tool (such as Tableau or Power BI) may cut back the Excel jungle to a degree, it won’t create the foundation needed for a scalable, data-driven business. Mashing-up your data in this way is a poor solution because BI tools aren’t specifically designed to organize and process data.
A data warehouse is the single, structured repository where all your data is organized so it can be put to good use. It’s the sole source of truth for your company and is foundational to The Dashboard Effect (using data intelligence to automate a culture of growth, profitability, and accountability).
Building a data warehouse can seem ominous. If you don’t have a data architect on staff, you may worry that data warehouses are the exclusive domain of other, uber-technical companies. Ten years ago, you would have been right, but today virtually any business can join the data revolution. Data warehouses are many times easier and more affordable to deploy than just a few years ago. Our current approach enables us to set up a data lakehouse in as little as two weeks.
There’s a cost and complexity threshold where migrating to a data warehouse makes obvious sense. Up until that point, however, a data warehouse may seem like an unnecessary expense.
Until you consider technical debt.
Technical debt is the recurring expense that results from taking shortcuts now. Without a data warehouse, you’re left mashing up your data from several sources into a single file. In this mash-up scenario, the painful cost comes when you want to add or change data sources or change reporting platforms. Even updating a source system to its latest version can break your reporting (which can be costly to fix).
If your business uses a BI tool to mash up your data, then your data architecture will look a lot like this:
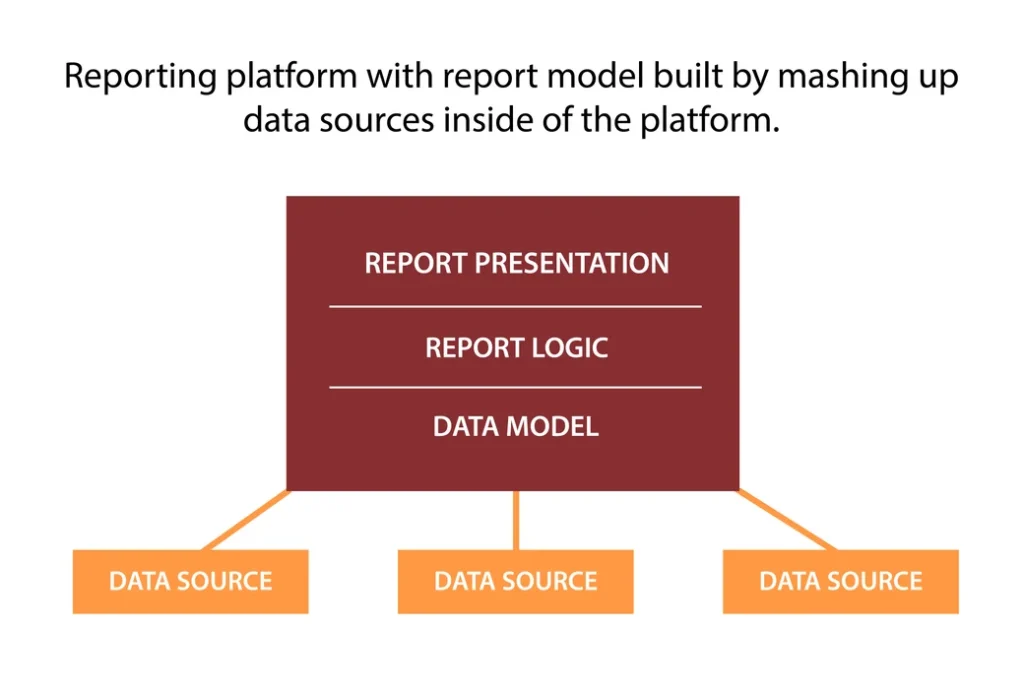
Figure 1. High-level view of typical data mash-up.
In academic terms, this means your data model inevitably ends up encapsulating your report logic, and that in turn is encapsulated by the reporting platform, tightly binding the report logic to the report presentation layer.
In nonacademic terms, this means that if you ever want to change one part of the system, you end up having to change all the parts (remember those old TV-VCR mash-up units? Same issue). Also, if you change a field or column in your CRM or accounting system, your mash-up tool will simply return a system error. Moreover, if you ever want to migrate to a new reporting platform, chances are you’ll be able to reuse little of your work.
But if you use a data warehouse, your architecture will no longer look like the above classic bad example and will instead have a much better structure:
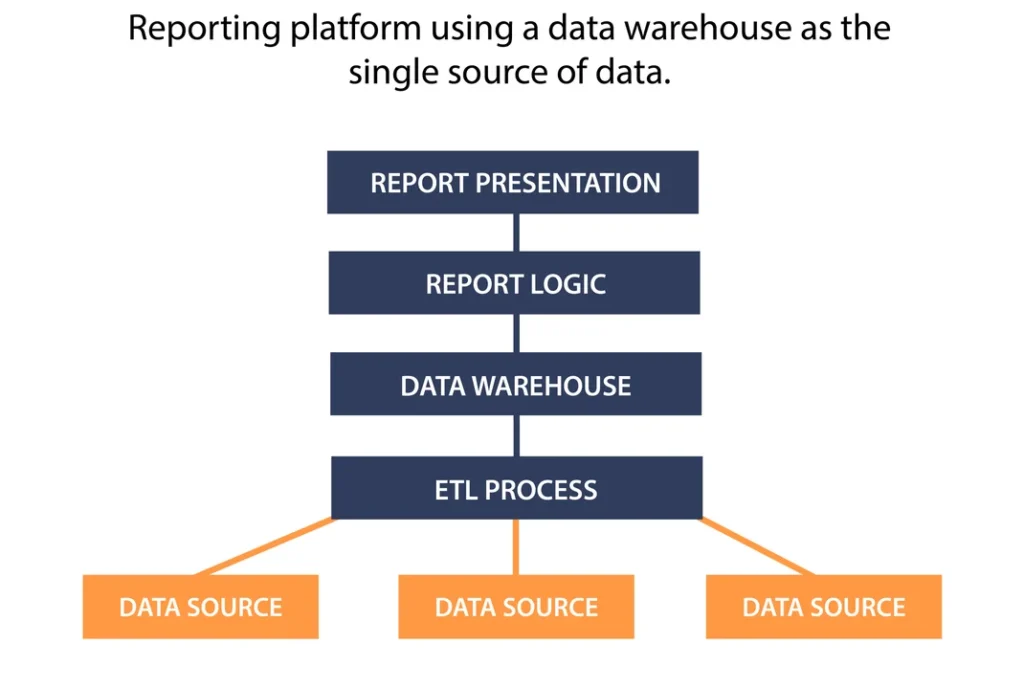
Figure 2. Data warehouse designed for flexibility and scalability.
With a data warehouse, no single tier of your architecture is tightly bound to another. You can change your ETL, save money by switching your business software, or switch your reporting platform to the latest and greatest. Whatever the change, you only need to worry about that one component rather than the entire stack. And if you add or delete a column from your CRM or accounting tool, your reports will still work rather than returning a general error (though they will need updating if you want to include the changed data).
Here’s another important benefit of data warehouses that often gets overlooked: What happens when you want to use multiple reporting tools? With mash-up tools, you’ll have to recreate the data model in each, assuming those reporting tools even have ETL and data-modeling functionality. With a data warehouse, you can simply connect those reporting tools to the system.
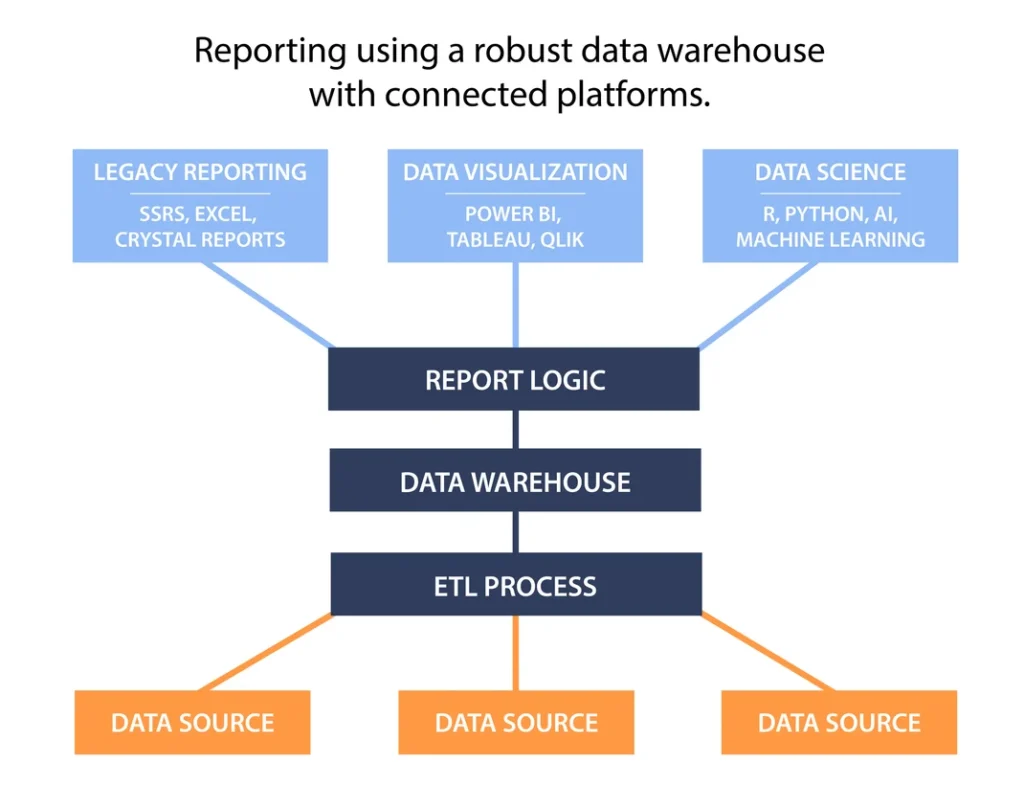
Figure 3. Robust data warehouse with connected reporting platforms.
Other considerations to support investing in a data warehouse:
A data warehouse protects your business systems.
- By minimizing direct access to your transactional software, you avoid impacting the performance of those systems and the risk that someone will mishandle them.
A data warehouse is the single source of truth.
- Unlike Excel, there’s no risk you’re using the wrong version of your data because everyone is accessing the same central source.
- Also, a properly designed data warehouse is “aware” of how current its data is, so users can know how up-to-date the information is.
A data warehouse is ACID.
- In computer science, ACID (Atomicity, Consistency, Isolation, Durability) is a set of properties that ensures database transactions are processed reliably.
A data warehouse maintains historical accuracy and historical context.
- Consider this scenario: You have two teams of salespeople. Your sales report shows total sales by team, by week. One team is significantly outperforming the other, so you decide to mix up the players to even out the teams. When you look at your report for the previous week, it should reflect the sales figures for the teams as they were configured at that time.
- A system that doesn’t maintain historical context will instead suggest that the teams were performing evenly the previous week, because the system is only aware of its current state and responds as though the current team assignments have always been the team assignments.
A data warehouse can hold massive quantities of data.
- Excel holds smaller quantities, less efficiently. Various BI tools may hold data, but accessing that data is often limited (some Cloud API’s will even throttle your data transfer after a certain amount of usage, making them poor choices for real-time reporting).
A data warehouse is fast.
- Desktop reporting tools are limited to the power of the desktop. The typical business computer may not be up to the task. A data warehouse on multicore servers with gobs of RAM and a speedy disk array is much more powerful; let it do the heavy lifting.
- Speed is important and here’s why. If an employee has to wait sixty seconds for a report to run and has to run that report five times daily over the course of a year, he or she will spend more than twenty hours waiting. For an employee making $75,000/year, that’s over $750 in wages spent just waiting. Not to mention the fact that the employee may stop using the report altogether out of frustration.
Data warehouses can be made regulation compliant (e.g., SOX, PCI, FERPA, HIPAA, SSAE16).
- Cloud-based BI services have variable compliance profiles, requiring you to work around limitations. Excel files on their own are never standards-compliant; additional controls must be placed around the access to and distribution of those files.
- A data warehouse enables you to have a single compliance profile for a single, master repository of your data.
A data warehouse is secure.
- You can control access through user-credentials and manage exactly who can access what.
- You can enforce who is allowed to modify data and who can only view data.
- You can easily audit every aspect of a data warehouse—who has access to what, what data was modified when, what the value of the data was before it was modified, etc.
A data warehouse is reliable.
- You can capture your data at any level of granularity.
- In the event of a disaster, you can restore your data to a specific point in time.
- You can set up a redundant infrastructure (e.g., server clustering, regional instances, etc.).
Data warehouses are affordable.
- Cloud-based servers that can be rented for as little as $100 per month typically provide more storage and processing power than many companies need.
- There are FOSS (free and open-source software) options.
A data warehouse relieves technical debt.
- Choosing not to build a data warehouse is taking on technical debt.
- Want to change the Cloud service provider for one of your key applications? With a data warehouse, you only need to update your ETL to bring the new source in to your existing structure. By contrast, if you use a data mashup tool, you’ll also need to update your data model and likely the reports it feeds.
- Want to change your reporting tool? You’ll need to rebuild your entire data model. Data warehouses are designed with reporting in mind, regardless of which reporting tool you use.
- Need to tackle big data? Data mashup tools don’t offer the performance you need.
- Plan on scaling up? As your number of data sources grows, the ETL and data model in your mash-up system will become unwieldy and unstable.
Want to Turn Your Raw Data into Business Intelligence?
Blue Margin can help you transform your data into a gold mine of actionable insights.
We do this by building a data lakehouse, or in some instances a data warehouse, and providing ongoing data management through our Managed Data Service. Leveraging an agile, sprint-based approach, we can take your business from raw data into data models to support a fully functioning, validated semantic layer in just a few short weeks. Check out the benefits of our data modeling services here.