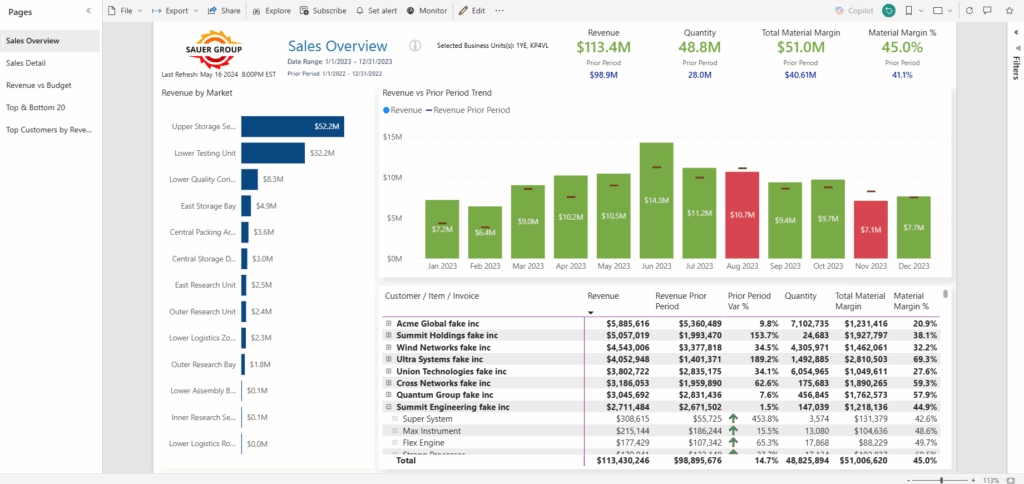
Near the end of March, Microsoft announced that Power BI would now be able to integrate with Google Analytics. Over the last few weeks, users have been discovering the numerous benefits of this integration and have found it to be incredibly useful, especially for companies with a large e-commerce presence. Some in the tech world would even call this a match made in heaven. 

What is Google Analytics?

Google Analytics is a must-have tool for any business with a website. It's crucial to monitor your web traffic, to gain an understanding of who is visiting your site, how they found it, and what they do once they are on your site. Here are some of the most useful features:

  • User Acquisition Analysis: Tracks how users find a website (e.g., via organic search, paid ads, referrals).
  • User Behavior Analysis: Provides insights into what users do on the site, such as the pages they visit, time spent on each page, etc.
  • Conversion Tracking: Tracking of specific events, like form submissions, product purchases, or significant user interactions.
  • Audience Insights: Breaks down website traffic by demographics, interests, geography, and more.
Unfortunately, Google Analytics data can sometimes end up on an island by itself, disconnected from the rest of the data sources businesses regularly monitor. And any data source that is not easily accessible or able to communicate with other data sources is not a very useful one.

View Website Traffic Data Alongside Sales Data in Power BI

Integrating Google Analytics with Power BI solves both of these problems. By importing Google Analytics data into your Power BI dashboard, you can see all of your website traffic data right alongside your sales data, CRM data, and any other data source you have connected to in Power BI. Not only can you see all of your important data in one place, but you can combine web traffic data from Google Analytics with data from other internal sources to gain a more accurate "big picture" view of how your website interacts with the rest of your business cycle.

Power BI's visualizations make Google Analytics data easier to understand

Plus, Power BI's intuitive visualizations make your Google Analytics data easier to understand. As reported by the Power BI blog, a Power BI user from Powered Solutions shared a screenshot of what his Power BI dashboard looked like when he connected it to Google Analytics - and this is right out of the box!

No offense to the developers at Google, who have made an incredibly powerful, detailed software in Google Analytics, but sometimes it's hard to find the insights you need amidst the myriad of numbers and graphs in GA. But when Power BI works its visualization magic, insights become immediately apparent on your dashboard.

Use Power Query to ask natural language questions

Another benefit to using Power BI to analyze your Google Analytics data is that you can use Power Query to ask natural language questions about your data and receive answers in the form of graphs. Rather than searching through the various reports and tabs in Google Analytics to find what you need, you can just ask Power BI, "How many new users visited this page in the last month?", and Power BI will show you with a graph.

More information on Power BI and Google Analytics

Read about Power BI Dashboard Case Studies for Private Equity Companies for some more in-depth details about how to get the most out of the Power BI/Google Analytics integration. Even without any adjustments, the insights and visualizations provided right out of the box are extremely useful.
 some more in-depth details about how to get the most out of the Power BI/Google Analytics integration in their write-up here, but even without any adjustments, the insights and visualizations provided right out of the box are extremely useful.

Enjoy the benefits of the perfect match of Power BI and Google Analytics and try for free on the Power BI site.

About Blue Margin
At Blue Margin, we don't just present data; we craft it into actionable insights. The tools? An AI-ready data platform built on Microsoft Azure and Power BI Dashboards tailored for clarity and precision. Our approach? The Dashboard Effect, a proven method that's not just our unique strategy but also the title of our book and podcast.

Our dedicated Senior Dimensional Modeling engineers, complemented by a team with over 75 years of collective experience, ensure that every aspect of your data journey is optimized, validated, and supported. From data validation to seamless Power BI integration, we address your challenges as a fractional data team.

If you have any questions about business intelligence, Power BI vs other platforms, or are curious how BI technology can help your business succeed, contact us here.


New call-to-action

Jon Thompson

Written by Jon Thompson

Jon Thompson is co-founder and Chief Strategy Officer at Blue Margin Inc. An author and speaker, Jon sheds light on how businesses can take advantage of a revolution in business intelligence to become data-driven and accelerate their success.