In this episode of Expert Insights Series, Blue Margin Co-Founder Jon Thompson hosts Tania DiCostanzo, Vice President of IT, Strategic Initiatives, and Data Analytics at Trace3. Founded in 2002 and backed by American Securities, Trace3 is a US$2bn provider of IT and consulting services with 3,500 customers in 48 states. Headquartered on both coasts, Trace3 has over 1,200 employees; 700 of those are engineers and data architects. For 20 years, Trace3 has provided IT strategy, solutions, and services to some of the world’s leading companies.
Tania joined Trace3 in 2015 with two decades of leadership experience via pharma company Boehringer Ingelheim, industrial company Ingersoll Rand, and IT leader IBM. During that time, she held numerous leadership positions, including Senior Principal Systems Engineer, IT Associate Director, and Global Head of Unified Communications. In this interview, she shares her perspective on the best practices for mobilizing data in a company.
Watch the full interview, listen to the podcast, or read the highlights below.
4 Key Takeaways:
- To accelerate your value creation plan and align the team, start with a rapid deployment company scorecard.
- Dashboards that “move the needle” have 2 key ingredients…
- Have an internal data team? Why Tania still brought in a BI partner.
- How to be a successful “data-mobilizer” for your company.
How Trace3 Accelerated Their Value Creation Plan with OKRs
“You really need to understand from the top – what do we need to be measuring?” – Tania DiCostanzo
Trace3 began using the OKR (Objectives and Key Results) process post-acquisition by American Securities in October 2021, when Trace3’s CEO, Rich Fennessy, and the executive team set the vision for company growth by defining their most essential performance metrics. From there, Trace3 partnered with Blue Margin to create an OKR dashboard to measure and monitor progress (read the case study). Below, Tania reflects on how this process helped accelerate the value creation plan by aligning leaders across functions. (For details on rolling out an OKR dashboard, see BMI’s VCP Accelerator.)
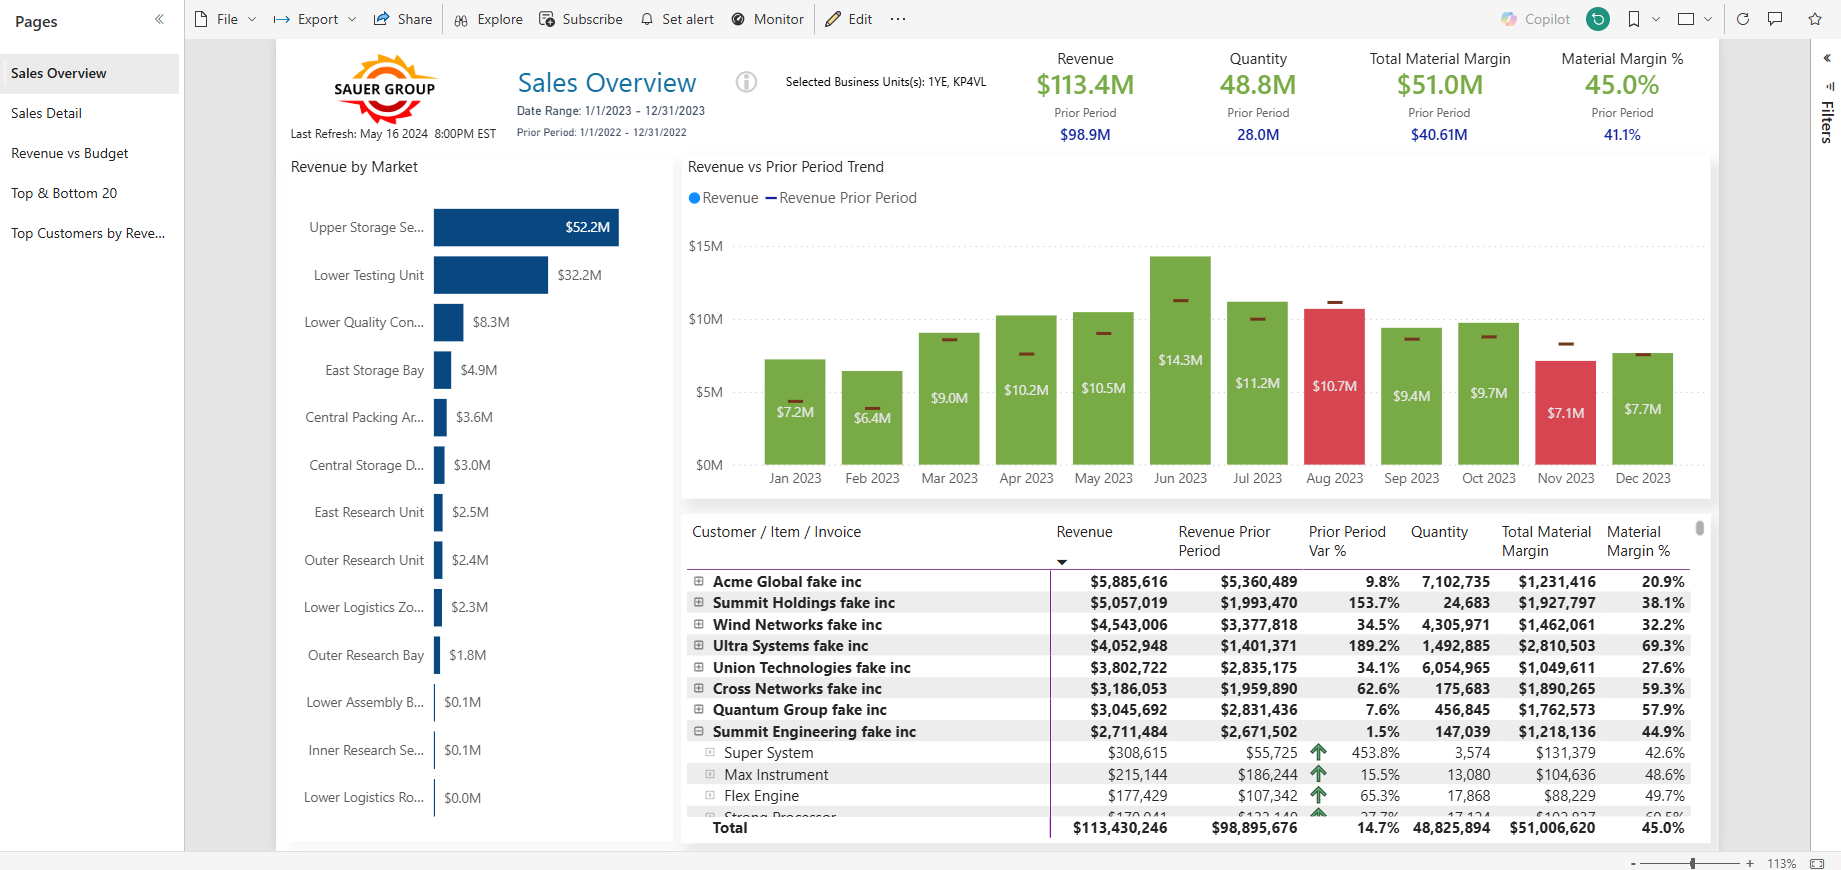
Dashboard Design Essentials: Clean Visuals, Key Metrics
“If it doesn’t drive action, why have it?” – Tania DiCostanzo
Dashboard design takes discipline. While our instinct is often “the more information, the better,” increasing the information on a dashboard quickly reaches diminishing returns. In the book Storytelling with Data, data visualization expert Cole Nussbaumer Knaflic shares the psychological importance of design simplicity. She writes, “Any time you put information in front of your audience, you are creating cognitive load and asking them to use their brain power to process that information” (Knaflic, 2015).
To that end, Tania underscores the importance of keeping non-essential metrics from reducing dashboard impact.
“When you start data projects, you need to ask, ‘why?’ Why do you need that metric?”
During design, make sure the metrics you choose to display directly influence the decisions/behaviors you want to improve. (The essentials of effective dashboards are discussed further here: How Not to Build a Dashboard.)
Two Reasons Internal Data Teams Would Hire a BI Consultant
Outside expertise can fast-track digital transformation. S&P Global Market Intelligence finds that only 10% of U.S. PE firms keep their data management functions in-house, while the other 90% outsource or balance between in-sourcing and outsourcing (S&P, 2022). Choosing an outsourced approach, Trace3’s sponsor, American Securities, referred Blue Margin.
Trace3 has a skilled internal data team, yet they hired Blue Margin for two primary reasons: to augment their small team and increase their speed to market. While these needs were met, Tania reflects on the benefits that have led her to continue the partnership. She values the lessons learned from similar companies and objective pressure-testing based on what has been successful in the market. In her words, Blue Margin showed Trace3 “what good looks like,” and brought an external perspective to challenge and advance Trace3’s thinking.
Successful Data Mobilizers Keep the Scope Narrow and Work Within Their Resources
Of the 250 companies and countless data teams we’ve partnered with, the consensus is that Tania is one of the most effective data mobilizers we’ve seen. She’s the Michael Jordan of data projects (we realize the comparison to MJ has been played out, but frankly, it applies here). Wanting to learn from the best, we asked Tania – how can others become effective data mobilizers?
“Start with what you have (data, tools, resources). Show value. Then expand. Don’t wait.” – Tania DiCostanzo
Using the Apollo 13 analogy, Tania recommends leaders start with the resources they have (even if they’re limited) and use an agile approach to development. By keeping the project scope narrow enough to execute quickly, you build momentum and buy-in for follow-on projects. Well executed data projects are an add-back investment, so it’s best to narrow focus on key value drivers. In fact, NewVantage Partners’ 2022 Data and AI Executive Leadership Survey finds that 92% of Fortune 1000 companies achieve ROI in data and AI (NewVantage, 2022).
Connect with Tania & Trace3
If you would like to connect with Tania, you can find her on LinkedIn or via Trace3.
Blue Margin helps private equity and mid-market companies quickly convert data into automated dashboards, the most efficient way to create company-wide accountability to the growth plan. We call it The Dashboard Effect, the title of our book and podcast. Our mission is to deliver breakthroughs early and often.