In the race to increase portfolio company value through add-ons, improved gross margins, and operational efficiency, private equity managers and their operating team colleagues often find themselves too busy chopping wood to stop and sharpen the axe. 

Successful companies that are attractive to future investors need actionable data and clear KPIs to provide transparency and focus. 

Management teams are selected for the expertise needed to usher their companies to a liquidity event. Without clear visibility into performance, deal teams can't responsibly give their management teams the latitude they need to apply their efforts and talent to their highest and best use. 

Lacking a firm grip on the company’s financial and operating metrics, managers become constrained. Similar demands placed on deal teams exacerbates the problem and can cause both to become frustrated and reactionary. 

“Through data analysis, business operators can get a clearer view of what they are doing efficiently and inefficiently within their organizations. When a problem is identified, professionals are capable of answering crucial questions.” - Michigan State University

When executives become lost in unverified, inefficient operations, there is little time left to define and operationalize the KPIs needed to identify issues and spur behavioral change. As a result, the executive’s role may devolve into a balancing act between managing the business and managing the board. 

The impact of the adage, “you can't effectively manage what you can't efficiently measure,” is more far reaching for PE firms than typical companies.

High-stakes investments, short realization horizons, and the disruption of new business units, systems, and personnel make the pressures of private equity investing acute. 

A Data-Driven Approach To Managing Your Private Equity Portfolios & Why Excel Isn’t the Answer 

According to MIT Technology Review, 95.5% of business data is never used, resulting in lost insight and clarity. Left unsolved, the lack of actionable data leaves deal and management teams resigning themselves to a suboptimal level of controlled chaos and confusion. Searching for answers, PE managers often end up beholden to Excel and its limitations in their efforts to understand the data and shape strategy.

For most portfolio management professionals, Excel frequently emerges as the analytical tool of choice. Excel is familiar, but can also further disperse data, fragment visibility, and create noise when clear signals are needed. Excel files require manual assembly and updates, and the clock starts on obsolescence the moment they’re produced. 

These lagging indicators distance the solution from the root issue and force reactive, high-pressure management. Data in these spreadsheets is typically in tabular form, making it difficult to understand and analyze. 

More often than not, Excel reports deliver marginal value and lead to requests for even more spreadsheets - leaving the issues of management constraint and frustration unresolved.

Getting a handle on the tidal wave of data may seem to be an elusive process, but it doesn’t have to be. 

Leaving Excel Behind and Starting on the Path to Reliable Growth

Increasingly, savvy private equity firms are utilizing purpose-built data warehouses and data visualization systems as a cost-effective method to overcome the obstacles and inefficiencies of Excel. 

Data warehouses tame the clutter created by silos of unconnected, out-of-sync data. Business-intelligence systems like Power BI and Tableau deliver reports and insights automatically, without the manual effort required in Excel. 

With newfound clarity comes team alignment, relief from frustration, and transformation of performance issues into strategies for growth. 

Below are four steps portfolio companies can take to immediately shape strategy and improve outcomes using the data they already have.

Step #1: Articulate Your Business Case and Define Your Assets (60 minutes) 

Start by defining your business objectives and the framework where business intelligence can take hold and have an impact.

Without clear direction, your efforts to operationalize data will meander and lose impact. Articulate the business case for BI by answering the following:

  • What are our highest-value initiatives over the next 12 months?
  • What are the greatest risks to meeting those goals?
  • What gives us a defensible position in the market?
  • What leading indicators most impact our bottom-line outcomes?

Next, identify the personas responsible for those those metrics. For each functional area of the business (i.e., Finance, Sales, Production, HR, Inventory, etc), what are the top 1 or 2 roles responsible for results?

For each persona, which key metrics should they manage? Use this thought-exercise: If cut off from communication for 6 months, which 2-4 metrics would you want each persona to be certain to deliver?

Once you have your goals, personas, and key metrics, you only need to identify the data sources from which those metrics can be sourced, and you're ready to put the data to work.

Example:

The VP of Sales is responsible for delivering a 20% YoY revenue increase. In order to achieve that goal, the VP should focus on the following KPIs:

  • Average revenue per customer exceeding $XK/mo
  • Average proposals out per sales rep of Y/mo
  • Sales headcount increase of 1.5 FTEs/mo

Step #2: Identify Low-Hanging Fruit (30 minutes)

“The starting point for realizing the potential of data and analytics is selecting the use cases that offer the greatest potential for value creation—and using those use cases to generate quick wins that create momentum for broader business transformation.” - Boston Consulting Group

With efficient planning and implementation, companies can achieve fast ROI from BI solutions.  

Start small. There’s no point in trying to boil the ocean--you’ll waste energy instead of producing results.

  • Make a plan that delivers value quickly.
  • Avoid perfectionism - Don’t wait to improve data quality, change a transactional system, or spend several months building a data warehouse before extracting value from your data.
  • Look for a good balance between light-lift and high-impact.  

For example: 

  • Sales: With better visibility into our sales funnel, the VP of Sales can more accurately coach his team and keep deals moving through the pipeline.
  • Marketing/Inventory: If we know which products have the highest seasonal value, we can focus our marketing efforts to promote sales.
  • A/R: If we know exactly which customers are delaying payment, we can improve our receivables.

Start where you can derive immediate value. Then iterate.

Step #3:  Enlist BI Champions, Seed Adoption (2 hours)

Your BI only produces value after being adopted and acted upon. This important last step is the true deliverable of your BI program, yet is overlooked by most companies. Don’t stop your drive at the 10-yard line.

“Don’t leave business users to figure out the commercial value of analytics on their own. Show it to them instead, via a network of advocates across the organization. Through these advocates, companies can proactively introduce the capabilities available to the business and provide expert support for those finding their way.” - Harvard Business Review

Employee buy-in is synonymous with becoming a data-driven organization. If the payoff from using the system isn’t crystal clear, they may fail to embrace data and regress back to ad-hoc prioritization.

Enlist BI champions

Identify 2-3 people who understand the connection between data and progress.

  • Choose a business sponsor to help advocate for project adoption. This will likely be a leader in a senior position who can gain buy-in from other key personnel.
  • Also, choose a technical resource such as an IT manager who can deliver access to the data. Having someone that understands the underlying data sources will help speed implementation and data validation. 

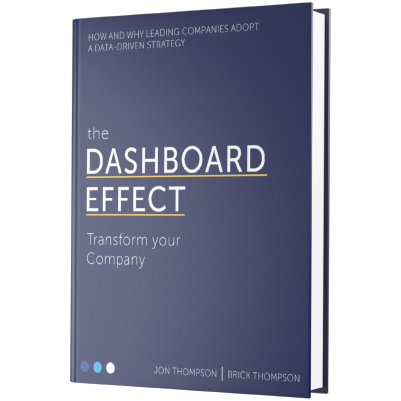
If you need to sell the concept and value of BI, have your selected champions read The Dashboard Effect.

New call-to-action

Shameless plug from the author: 

This book outlines why and how data assets can be put to work to improve company culture and get everyone rowing in the same direction. Drop me a line and I’ll send you a copy.

Consider outsourcing your BI development.

  • Most resources have “day jobs” that keep them from moving the needle through data. Shifting a company to become data-driven requires sustained intention.
  • A hired resource won’t have the pressures of competing priorities. They also won’t fall into the trap of “we’ve always done it this way.”
  • The right resource will also have an in-depth understanding of the BI project and the goals you’re trying to accomplish. Because of their experience and expertise, they will be able to clearly communicate the project value at both the organizational and individual levels.

Gaining early support from your champions and having them gain buy-in from others in the organization, is a crucial step to successful BI implementation that will pave the way for the future success of the project.

Step #4: Work in Sprints (Ongoing)

Working in shorter time frames to accomplish smaller sets of deliverables (often called sprints), offers a systematic way to understand your data, saving you time, headaches, and frustration. When you start with tangible quick wins, you’re focusing on data that can be understood quickly and easily. 

Rather than thinking of this as a one-time project, BI implementation is an ongoing, iterative process. 

Here are some keys to utilizing sprints in your BI implementation:

  • Look at one data source or one report for one persona. Giving each persona one data point to focus on will help them become comfortable with the data, and understand the benefits provided. 
  • Address any problems that you discover, and decide how to fix them now. Don’t let problems linger. Quick corrections will ensure data accuracy and prevent small problems from becoming big ones.  
  • Take what you’ve learned by analyzing a manageable amount of data to the analysis of other data sources. Getting good at analyzing your initial data insights will help you plan and prepare to scale your BI implementation. This gives you the opportunity to learn what works and what doesn’t early in the process. 

Relying on this framework and seeing its success is another important aspect of shifting a company’s mindset toward a data-driven culture. 

Private Equity Portfolio Analytics Takeaway

Private equity firms that use business intelligence to manage their portfolio--from core financial metrics to actionable operations data--have a decided advantage.

In addition to being more attractive to companies they want to acquire, PE firms who understand the value of data and how to mobilize data in portfolio companies can help their portfolio companies achieve significant transformation in tight investment windows.

New call-to-action

For Further Reading: 

Power BI Dashboard Case Studies for Private Equity Companies: See how Private Equity uses data intelligence and Power BI dashboards to drive performance and profit.

Private Equity Turns to Business Intelligence to Maximize Investments: Private Equity is turning to data intelligence to maximize investments. See how.

How To Implement Portfolio Analytics To Manage Your PE Portfolio: Learn four steps portfolio companies can take to immediately shape strategy and improve outcomes using the data they already have. 

Private Equity Advantage: Data Intelligence Strategies You Can Steal - Learn the data optimization strategies PE firms can use to differentiate themselves through digital transformation.

Jon Thompson

Written by Jon Thompson

Jon Thompson is co-founder and Chief Strategy Officer at Blue Margin Inc. An author and speaker, Jon sheds light on how businesses can take advantage of a revolution in business intelligence to become data-driven and accelerate their success.