


When determining the right data warehouse architecture and design, the two most commonly discussed methods are the approaches of Ralph Kimball and Bill Inmon.
Goals of a Data Warehouse
- Enable efficient development of accurate, performant, and secure reports, which will provide critical insights to enhance business outcomes.
- Support the efficient addition of new data sources while maintaining good performance and scalability.
- Support future, unknown reporting needs, and be able to respond to changing business requirements quickly.
Introduction: Inmon vs Kimball
When determining the right data warehouse architecture and design, the two most commonly discussed methods are the approaches of Ralph Kimball and Bill Inmon. The Kimball method was codified in the late 90’s (although certain elements have been around much longer) and emerged as the preferred method for efficiently creating modern, agile data warehouses. The Inmon data warehouse method, by contrast, is more representative of the traditional, monolithic enterprise data warehouse, also commonly known as the Corporate Information Factory (CIF).
Blue Margin leans heavily on dimensional modeling (i.e., the Kimball approach) for architecting data warehouses, but also incorporates normalized data schemas (i.e., the Inmon approach) at the data warehouse level when warranted. In other words, we primarily adhere to the Kimball approach to data warehouse architecture but bring in elements of the Inmon approach when it will simplify data ingestion and storage processes. This hybrid approach, commonly referred to as a “Modern Data Warehouse,” is the preferred methodology of current luminaries in the space (see references at bottom). This paper will briefly discuss the pros and cons of both the Inmon and Kimball methods, and how Blue Margin uses them to deploy data warehouses that:
- Enable a scalable, secure, and robust reporting data model
- Support the production of actionable reports quickly
- Support modular expansion to new data sources and reporting area
- Are relatively simple to understand, document, and manage
What is the Inmon method?
At a high-level, the Inmon method specifies building normalized (i.e., “third-normal-form”) databases that reduce data redundancy. Normalized databases minimize data repetition by using more tables and the accompanying joins between those tables. A key benefit of this normalized model is that it can reduce data loading complexity while also reducing data redundancy, thus saving on storage space.
However, these benefits come with complexity. Business analysts and report writers must navigate through a large number of tables and joins in order to analyze data and create reports. This reduces the number of people who can effectively work with the data warehouse to those with specialized skills. To mitigate this problem, Inmon suggests building an additional layer of dimensional “data marts” (i.e., groups of denormalized tables with repetition of data, less joins, and fewer tables) on top of the normalized database to help ease the burden on end-users. However, this countermeasure introduces an additional layer of complexity.
The Inmon method is a top-down approach, meaning a full schema is defined based on known data sources (i.e., transactional systems), and data is kept fully normalized throughout development. In this way, the Inmon approach is akin to “waterfall” software development (as opposed to agile development), resulting in longer-duration projects, higher development hours, and higher risk that the final product may get out of sync with business objectives as technical development cycles increase. This potential disconnect is exacerbated by the fact that Inmon models require most or all of the data warehouse to be completely developed before reports can be created. Additionally, making significant changes to an existing Inmon model (e.g., structural changes necessitated by changing business requirements) can be slow, expensive, and inherently risky.

Normalized Data Model:
- Lower data redundancy
- Higher complexity/number of tables & joins
What is the Kimball method?
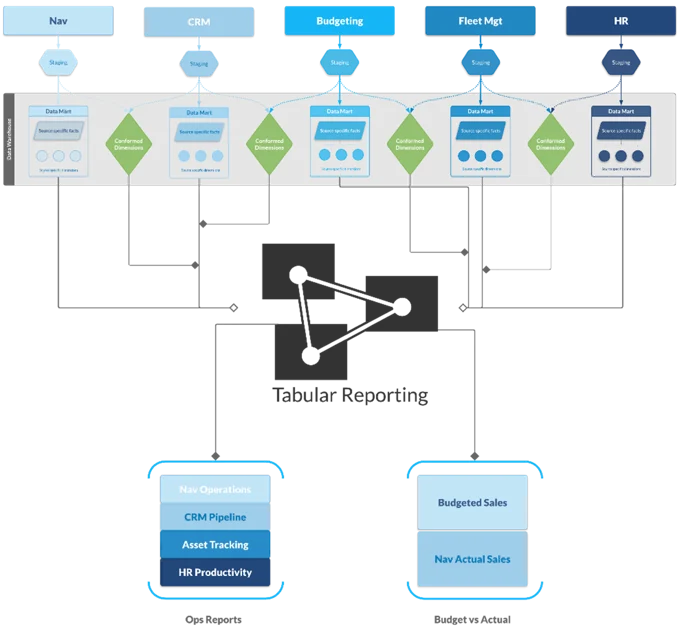
The Kimball method is based on dimensional modeling and the “star schema,” where the benefits of data-marts are intrinsic to the design. A dimensional model is designed for efficiently reading, summarizing, and analyzing numeric data (such as balances, counts, weights) and applying dimensional data (such as customers, departments, and geography) to group, slice, and categorize the numeric data. Denormalized models are therefore well-suited for reporting and analytics.
Additionally, the Kimball method allows for an agile, modular approach to data warehouse development. Modular development enables fast delivery times, lower overall cost, a shorter path to actionable reports, and reduced risk of development getting out of sync with business requirements.
These characteristics are well suited to current business trends for BI development. Individual departments within companies have increasing (and previously unavailable) access to self-serve BI tools, and the push to “self-service” analytics has never been greater. When data warehouses are highly complex, this trend often leads groups within a company to create their own “mini” data marts, which can be problematic from a governance standpoint. For example, it can become difficult for a company to know whether measures are calculated consistently across departments (e.g., Net Revenue). To counter this problem, the company’s data warehouse must respond quickly to individuals’ self-serve reporting needs. It must be faster and easier to use than individuals’ “shadow” data marts, eliminating the hurdles that cause groups to create information silos. The Kimball approach supports these needs well.
Furthermore, reporting is more efficient within a Kimball framework, as most modern BI tools (e.g., Power BI, Tableau, Qlik, and Excel’s PowerPivot, to name a few) are optimized for reporting from denormalized, dimensional star-schemas.
Lastly, because the cost of storage is increasingly nominal, the additional cost of repeating data (or “common keys”) across tables in the Kimball method is immaterial in the vast majority of cases. Furthermore, loading reports and processing complex measures in a Kimball model is usually more performant, unhindered by the larger number of joins and tables required by 3rd-normal-form architecture.
The Blue Margin Approach
Blue Margin’s data management solution embraces the concept of Bimodal BI (a term coined by Gartner): incorporating the agility of star-schemas to rapidly deliver business-driven value, and introducing Inmon elements where needed to provide for fundamental IT-driven requirements such as reliability, governance, standardization, performance, and security.
This hybrid approach (with a Kimball bias) delivers scalable data warehouses that produce ROI quickly by prioritizing immediate and specific reporting needs, and enable efficient bolt-on of new subject areas as they arise. While the Kimball methodology is prominent at the beginning of the data warehouse lifecycle, an organic progression to a more Inmon style “enterprise” data warehouse may emerge as appropriate for loading data efficiently. If the number of data sources remains relatively small, the data warehouse may remain in a purely Kimball framework indefinitely.
That said, due to the technical complexity and overhead of the model, and to allow time for the business requirements to solidify, we resist Inmon elements until the ROI is clear-cut. Additionally, when adding Inmon elements to the data warehouse, we maintain a dimensional (star schema) structure at the OLAP layer (i.e., the layer that most report writers and analysts will connect to).
Strategic Considerations for Data Warehouse Best Practices
Aside from the technical advantages, other strategic considerations to make are:
- A data warehouse protects your business systems.
- By minimizing direct access to your transactional software, you avoid impacting the performance of those systems and the risk that someone will mishandle them.
- A data warehouse can maintain historical accuracy and historical context.
- As your business changes, reports should reflect key metrics as they were at the time to help identify patterns, trends, and growth.
- Data warehouses can be made regulation compliant (e.g., SOX, PCI, FERPA, HIPAA, SSAE16).
- Cloud-based BI services have variable compliance profiles, requiring you to work around limitations. Excel files on their own are never standards-compliant; additional controls must be placed around the access to, and distribution of those files.
- A data warehouse enables you to have a single compliance profile for a single, master repository of your data.
- A data warehouse is secure.
- You can control access through user-credentials and manage exactly who can access what.
- You can enforce who is allowed to modify data and who can only view data.
- You can easily audit every aspect of a data warehouse—who has access to what, what data was modified when, what the value of the data was before it was modified, etc.
Simplifying Data Warehousing for Business Success
A centrally planned data warehouse (i.e., a normalized, Inmon-centric, Corporate Information Factory) is similar to a centrally planned economy. While comprehensive and logical at the highest level, it prioritizes technical considerations over business requirements. As a result, adapting the model is difficult when incorrect business assumptions and unanticipated reporting needs inevitably emerge. By contrast, the modern data warehouse is more decentralized, agile, and driven by tactical business requirements.
Business users won’t adopt tools that are difficult to understand. A fully normalized database makes an analyst’s life complicated and requires a steep learning curve. Conversely, a star-schema, dimensional model that is easy to import, understand, and use in modern BI reporting tools caters to business users and is the foundation for a successful data warehouse deployment.
Our hybrid modeling approach for data warehouses applies to data lakehouses as well.
Want to learn more? Schedule a demo with one of Blue Margin’s Business Intelligence Consultants today.
References and Additional Reading
- SQLBI METHODOLOGY: https://www.sqlbi.com/wp-content/uploads/Introduction-to-SQLBI-Methodology-draft-1.0.pdf
- A modern data warehouse: https://www.sqlchick.com/entries/2017/1/9/defining-the-components-of-a-modern-data-warehouse-a-glossary
- Dimensional Data Warehouse: https://www.guru99.com/dimensional-model-data-warehouse.html
- Two powerful ideas: https://www.kimballgroup.com/2002/09/two-powerful-ideas/
- Inmon or Kimball: Which approach is suitable for your data warehouse?: https://www.computerweekly.com/tip/Inmon-or-Kimball-Which-approach-is-suitable-for-your-data-warehouse
- Difference between the corporate information factory and DW Bus architecture: https://www.kimballgroup.com/2004/03/differences-of-opinion/
- Dimensional Modeling manifesto: https://www.kimballgroup.com/1997/08/a-dimensional-modeling-manifesto/