
Power BI vs. Excel: How to Match Your Data Needs to the Right Tool
Microsoft Excel has been the default data tool for decades, and for good reason. It is flexible, familiar, and available on virtually every work computer. Most business users already know how to use it without any training. For a lot of day-to-day tasks, it is still the right choice.
Power BI is a different kind of tool built for a different kind of problem. It connects to your data sources directly, updates automatically, and makes performance metrics visible to everyone in an organization simultaneously, not just the person who built the spreadsheet. The question is not which one is better. It is which one fits the job.
Where Power BI Outperforms Excel
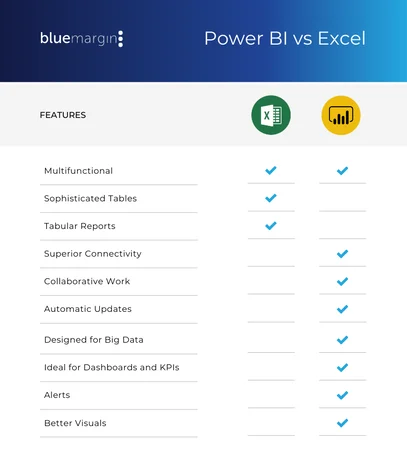
Power BI is purpose-built for enterprise analytics: connecting multiple data sources, surfacing KPIs in real time, and distributing that visibility across an entire organization. Where Excel requires someone to manually pull data, build a model, and send a file, Power BI handles the data pipeline once and keeps every report current automatically. The right people see the right numbers without anyone having to refresh a spreadsheet or reconcile conflicting versions.
That automation is what makes Power BI effective for driving accountability. When field technicians, managers, and executives are all looking at the same live data, performance conversations shift from debating the numbers to acting on them. We covered exactly how this plays out in practice in our CoolSys case study, where real-time dashboard visibility contributed to a 4 to 5% improvement in operating margins and a 52% reduction in employee turnover.
Power BI also handles scale that Excel was not designed for. When data comes from multiple systems, or when a report needs to serve hundreds of users across a company, a spreadsheet model breaks down quickly. Power BI’s data modeling and integration capabilities are built specifically for that complexity, pulling from disconnected sources into a single, consistent view. For manufacturers managing production data across multiple facilities, for example, the ability to get a consolidated view of operations in real time changes what decisions are possible.
At its best, Power BI gets the right information to the right people at the right time, eliminating the lag and inconsistency that come with spreadsheet-based reporting.
Where Excel Still Belongs
Excel remains the better tool for individual analysis, ad-hoc exploration, and tasks where one person needs to work through a dataset without involving a broader team. Researchers can crunch numbers and test hypotheses quickly. Managers can run a one-off analysis on project data without needing a dashboard built around it. Finance teams use it for models that require the kind of freeform cell-level control that a BI platform is not designed to support.
The user-friendliness matters too. Excel has a much shallower learning curve than Power BI, and for tasks that do not require real-time data or shared visibility, that accessibility is a genuine advantage. There is no reason to build a Power BI report for something a well-structured spreadsheet handles in twenty minutes.
How to Choose the Right Tool for the Task
The simplest way to decide is to ask whether the output needs to be shared, kept current automatically, and used to drive decisions across a team. If the answer to any of those is yes, Power BI is the stronger choice. If the task is exploratory, personal, or one-time in nature, Excel is usually faster and easier.
Most organizations end up using both. Excel handles the analytical work that feeds into decisions at the individual level. Power BI handles the reporting that keeps the whole organization aligned around shared goals. Designing those Power BI dashboards well is what determines whether the investment in the platform actually changes behavior or just produces reports nobody opens.
If your team is still relying on spreadsheets for reporting that would be better served by a live dashboard, talk to one of our experts about what a Power BI solution would look like for your organization.