Your overall margin blends hundreds of customer relationships and product lines into one number. Inside that blend, some accounts are highly profitable, some barely break even, and a few cost more to serve than they bring in. The reporting that separates them shapes pricing, product mix, and where your sales team spends its time.
Before a sale, the same reporting carries extra weight. In a recent episode of The Dashboard Effect on how data and AI are changing private equity exits, the hosts recommended that if you have limited time before going to market, you prioritize profitability by customer and by product. Buyers look at it early, and building it well takes several connected pieces of work, each one adding to the last.
Trace revenue to the customer and the line item
Revenue usually starts in the ERP or billing system, organized by invoice. Before any cost enters the picture, decide with your finance, sales, and operations leaders which revenue lines count, how credits, discounts, and rebates are treated, and whether any services are booked separately. Teams often answer these questions differently, and one written answer settles most of the debates a first profitability report would otherwise spark.
Choose the margin measure at the same time. Gross margin by customer is a common first build, and contribution margin adds the direct costs of serving each customer, giving you a fuller picture in exchange for more data.
Attach each cost where it occurs
Direct costs sit across job costing, payroll, time tracking, purchasing, and freight, each organized its own way. To tie a dollar of cost to a specific customer or product, you bring those systems together in one place and map every source to a single record for each customer and each product, whatever names or codes the source systems use.
Mapping usually takes the most work, particularly if acquisitions have left you with several sets of customer and item records, and the payoff extends well past this report, since customers and products that line up across systems line up for every question that follows.
Turn allocation into a written rule
Shared labor, overhead, freight, and cross-charges between business lines belong to many customers at once, so each needs a rule that divides it. Your rules may live in a spreadsheet and in the memory of one experienced analyst, who rebuilds the view by hand each quarter.
Write the rules down, get your finance lead’s approval, and encode them in the data model so anyone reviewing the report can see how each number was calculated. Clear rules applied the same way every period are enough to start, and finance can sharpen them over time.
Prove the numbers tie out
Build one view first, such as margin by customer over the trailing twelve months, and reconcile it to your financial statements. The total across all customers should match the reported figures, with any difference explained.
Once your leaders see customer-level numbers add up to figures they already know, they trust the view and act on what it shows, and each new cut by product, location, service line, or salesperson extends a model that already works.
Put margin in front of the people who set prices
Refresh the view automatically and share it with the people who make pricing, sales, and operational decisions. Sales leaders see which accounts deserve more attention, operations spots customers with an unusually high cost to serve, and leadership reviews product mix knowing which lines carry the business. A small set of clearly defined measures, easy to drill into, keeps each person’s answer close at hand.
Equilibrium Catalysts, an industrial chemical company and one of our clients, saw how much detail surfaces once cost and revenue sit side by side. Its dashboards uncovered roughly $1 million in unbilled services, and a clear view of costs by carrier let the team recapture hundreds of thousands of dollars in freight overhead by shifting volume between carriers.
Tell a clear earnings story at exit
Buyers want to understand the quality and sustainability of your earnings. A profitability view built on agreed definitions and documented allocation lets your management team answer their questions quickly and with confidence, and consistent, well-integrated data helps protect valuation through diligence.
Ask follow-up questions with AI
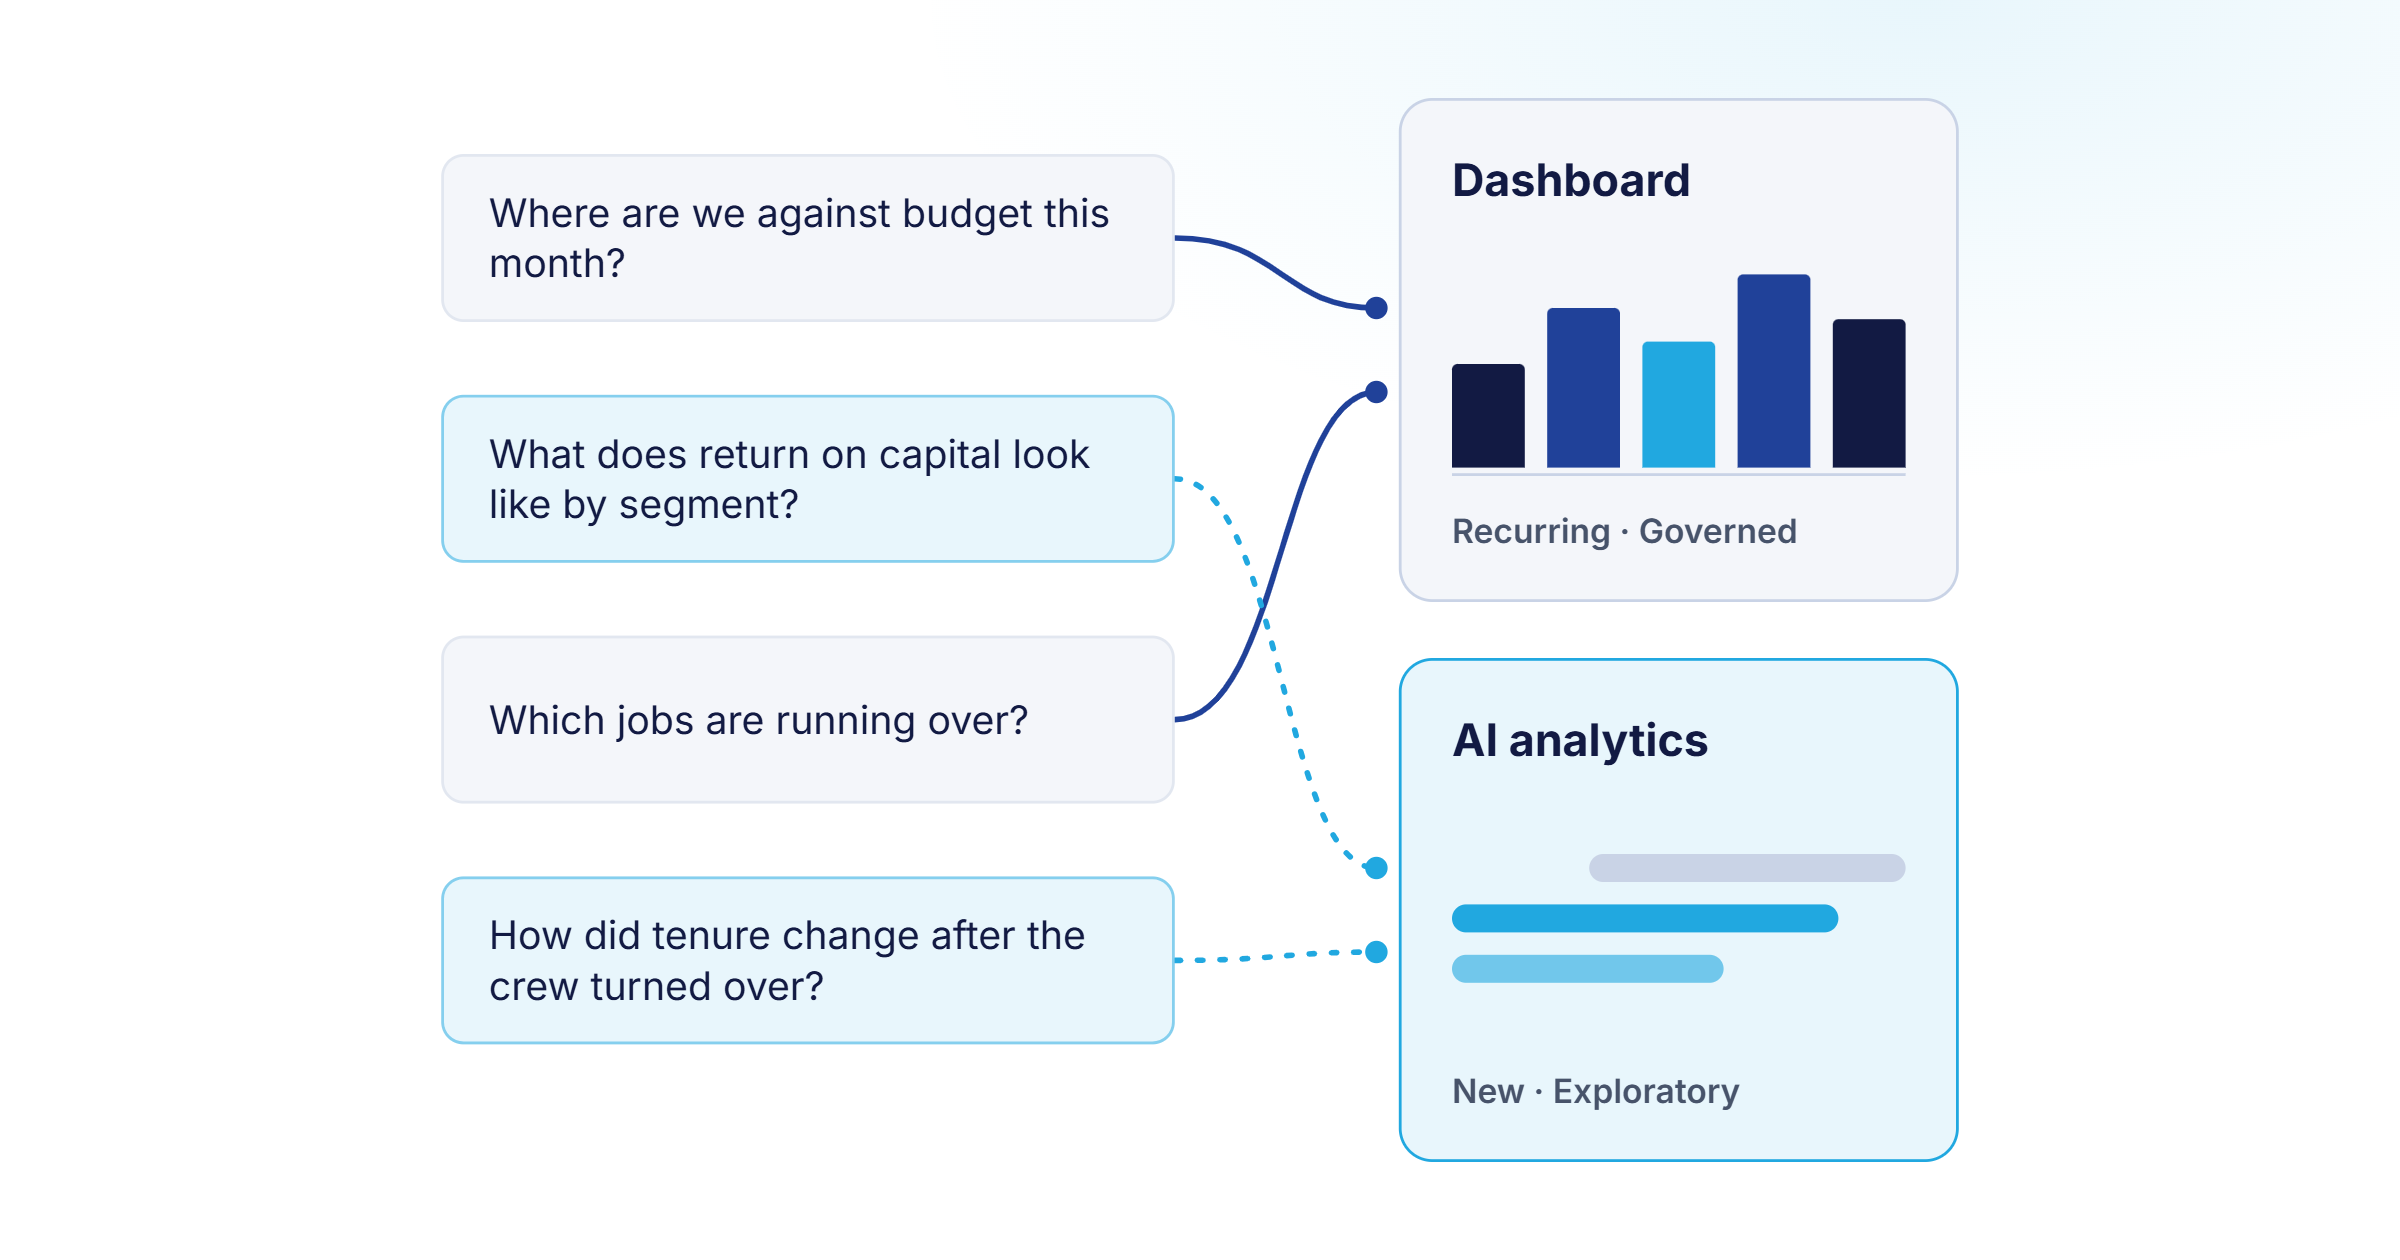
With definitions and allocation encoded in the data, AI analytics can work directly on profitability. Your CFO can ask for trailing-twelve-month margin by service line in plain language and follow up about specific customers, regions, or products in the same conversation. The answers reconcile to governed reporting, because the AI reads the same definitions, mappings, and allocation rules the report uses.
A practical sequence
Start with a working session among finance, sales, and operations to settle the revenue definition and the first margin measure. Connect the revenue and direct-cost systems next, and map customers and products across them. Document and approve the allocation rules, then build and reconcile one view. Once that view ties out, share it with the people who set prices and serve customers, add new cuts as questions come up, and extend AI analytics onto the same governed data.
Getting started
Profitability by customer and product draws on every part of the data foundation: shared definitions, connected systems, documented allocation rules, and validated reporting. To talk through where your revenue and cost data live today and what a first profitability view could look like, schedule a conversation with our team.